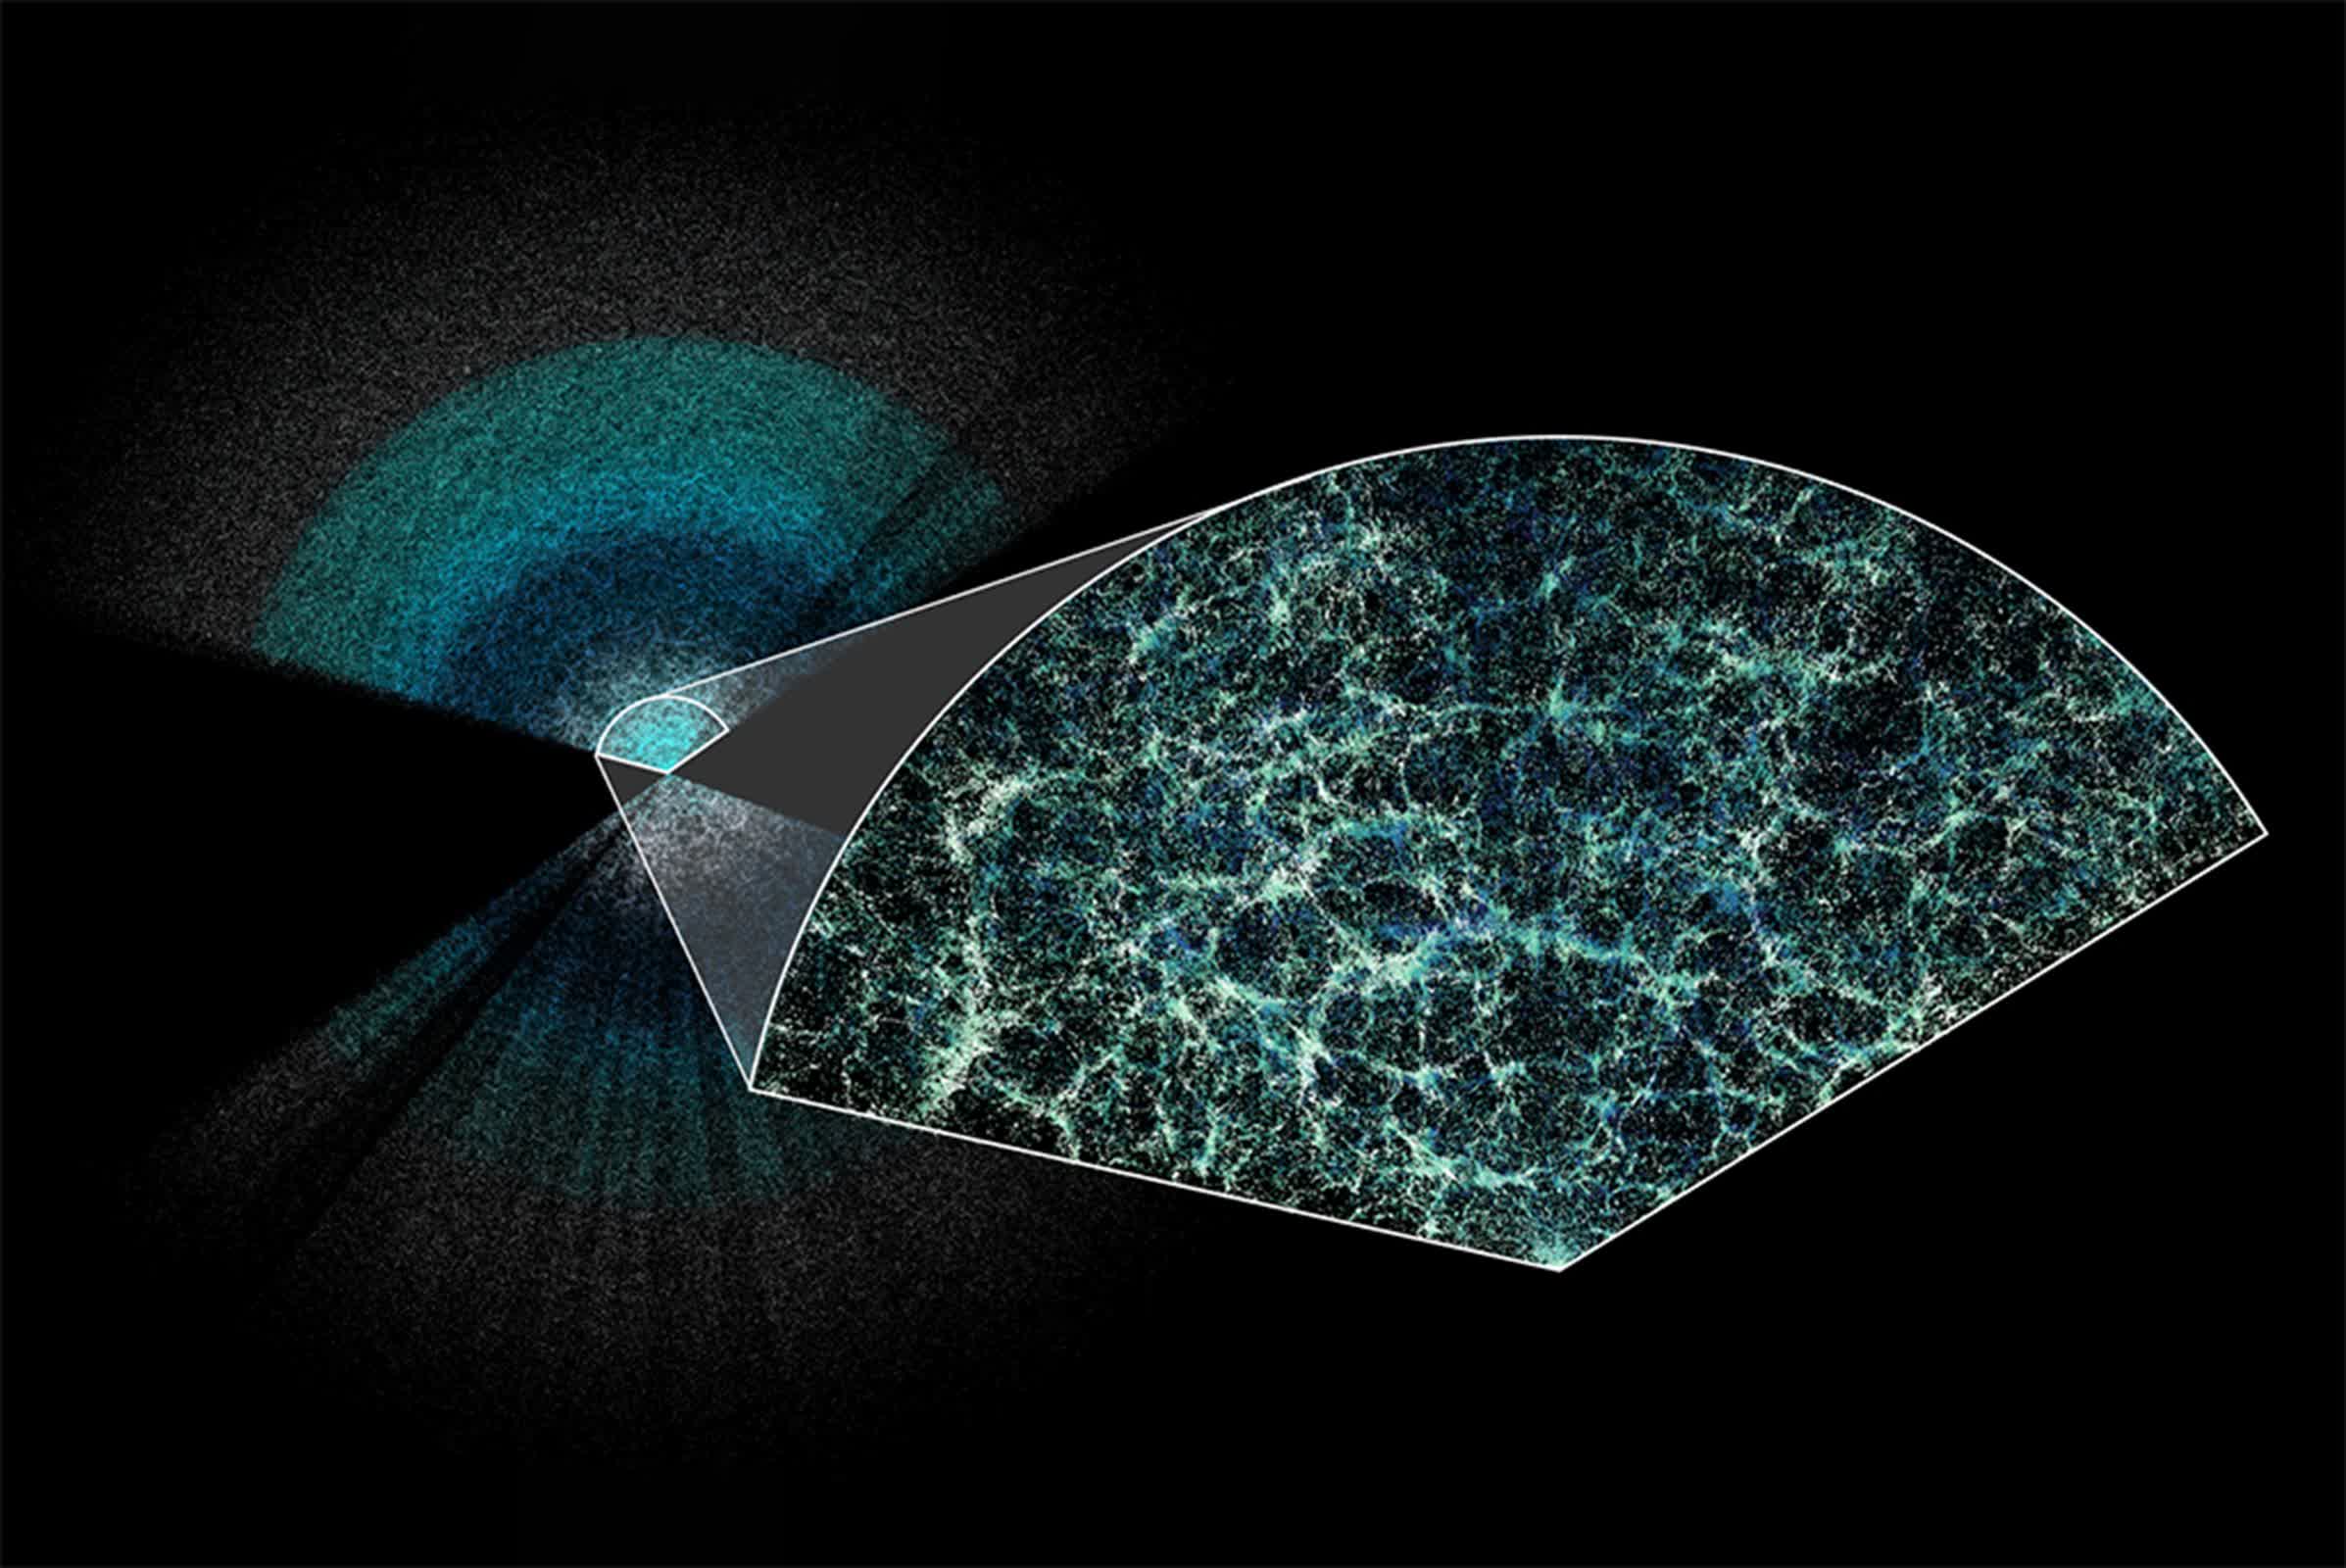
Why it matters: Researchers at Berkeley Lab have created the largest 3D map of the universe, with a precision of 1 percent. But what they discovered is startling in its implications and raises questions about everything science knows about the universe, starting with the premise that maybe dark energy is not constant throughout time as was previously thought.
Over the past few years the Dark Energy Spectroscopic Instrument, or DESI – a scientific research instrument for conducting spectrographic astronomical surveys of distant galaxies – has repeatedly mapped the distance to 35 million galaxies and 2.4 million quasars across one third of the area of the sky.
In ideal conditions, DESI cycles through a new set of 5,000 galaxies every 20 minutes, or more than 100,000 galaxies a night, explain researchers at the Lawrence Berkeley National Laboratory (Berkeley Lab), which manage the project.
That's years of 5,000 robotic positioners pointing DESI's fiber-optic eyes at preselected sets of galaxies to measure their spectra, from which one can gauge how much the universe expanded as the light from them traveled to Earth. And the end result? Well, we haven't gotten to that point yet, but researchers at Berkeley Lab have achieved a significant milestone: the largest 3D map of the universe ever made as well as the most accurate one, with a precision of better than 1 percent.
Or more specifically, DESI's overall precision on the universe's expansion history across 11 billion years is 0.5 percent, and the most distant epoch, covering 8-11 billion years, has a record-setting precision of 0.82 percent.
With the light from these far-flung objects in space just now reaching DESI, scientists can map the cosmos as it was in its youth, thus uncovering one of the biggest mysteries in physics: dark energy, the unknown ingredients causing the universe to expand faster and faster.
The map confirms that the expansion of the universe is speeding up, the scientists say – and also raises the possibility that dark energy is not constant throughout time as has previously been suggested.
"What we are seeing are some hints that it has actually been changing over time, which is quite exciting because it is not what the standard model of a cosmological constant dark energy would look like," Dr Seshadri Nadathur, a co-author of the work and senior research fellow at the University of Portsmouth's Institute of Cosmology and Gravitation, told The Guardian.
What this could possibly mean is that scientists may have to start from scratch in their understanding of the universe, Professor Carlos Frenk, from Durham University and a co-author of the research told The Guardian. This includes "revising our understanding of basic physics, our understanding of the big bang itself, and our understanding of the long-range forecast for the universe."
Researchers shared the analysis of their first year of collected data in multiple papers and in talks at the American Physical Society meeting in the US and the Rencontres de Moriond in Italy.
With one year of data, the researchers can already measure the expansion history of the universe at seven different slices of cosmic time, each with a precision of 1 to 3 percent, says Nathalie Palanque-Delabrouille, a Berkeley Lab scientist and co-spokesperson for the experiment.
This is what the researchers see as they study DESI's map: strands of galaxies clustered together, separated by voids with fewer objects. It is quite the contrast to the very early universe, which was a hot, dense soup of subatomic particles moving too fast to form stable matter, they explain. Among those particles were hydrogen and helium nuclei, collectively called baryons.
Tiny fluctuations in this early ionized plasma caused pressure waves, moving the baryons into a pattern of ripples. As the universe expanded and cooled, neutral atoms formed and the pressure waves stopped, freezing the ripples in three dimensions and increasing clustering of future galaxies in the dense areas. Billions of years later, we can still see this faint pattern of 3D ripples, or bubbles, in the characteristic separation of galaxies – a feature called Baryon Acoustic Oscillations (BAOs).
By measuring the apparent size of these bubbles, researchers can determine distances to the matter responsible for this extremely faint pattern on the sky. Mapping the BAO bubbles both near and far lets researchers slice the data into chunks, measuring how fast the universe was expanding at each time in its past and modeling how dark energy affects that expansion.
